With the right timingto the highest revenues
In the capacity market, precise forecasts are essential in order to maximise revenues. A large number of important factors, such as weather and production data, remit messages and seasonal effects, flow into a good forecast. It is therefore crucial to update the data as close as possible to the gate closure time (GCT) in order to calculate precise bids.

How balancing service providers increaserevenue with the right timing
We continuously monitor the performance of our forecasts and realised that the closer to the GCT our bids are recalculated, the higher the revenues are.
Many participants in the balancing capacity market calculate their final bids one day before the end of the auction. This often leads to lower surcharges or to their bids being further ahead on the merit order curve (MOC). Earlier calculations mean more uncertainty and a more cautious strategic direction. This is particularly disadvantageous for system operators who market their flexibility via a service provider (SDL), as they either:
- have no influence on the bid calculation and must rely on the marketing by the SDL.
- Due to a lack of automation, they have to calculate and report their bids the day before.
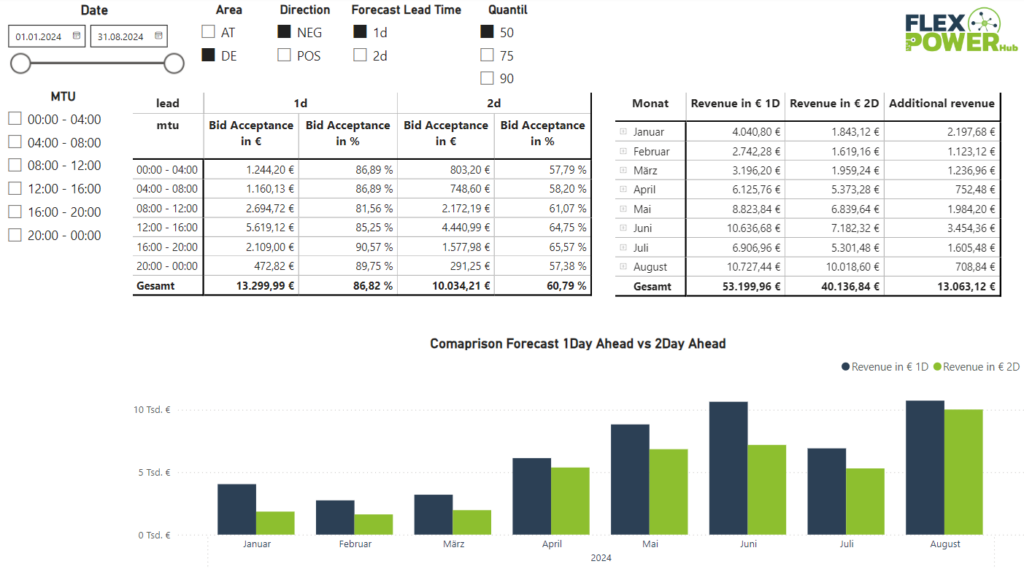
To illustrate this disadvantage, we have visualised the performance of two different calculation times in a simple dashboard. Firstly, bids that were calculated 2 days before service provision (2DA) and secondly, bids that were calculated 1 day before (1DA). Our AI forecast was evaluated for 50%, 75% and 90% risk percentiles on the MOC in the secondary balancing market. The 1DA forecast was calculated around 06:00, i.e. approx. 3 hours before the GCT, while the 2DA forecast is calculated the day before.
You can see how big the difference actually is in our dashboard, which you can filter according to your own interests.
Overview
The following filters can be selected in the dashboard:
- Date: period – this is also continuously updated
- Area: The German and Austrian control areas are evaluated
- Direction: Secondary positive or negative
- Quantile: 50%, 75% & 90% – The quantiles refer to the forecast merit order curve.
- MTU: Market Time Units = product time slices and can be selected individually.
